TIBCO Enterprise Service Bus provides a complete set of ESB products, these products need to be combined into a solution architecture. For my current customer I designed and implemented the following monitoring and reporting solution that resulted in a significant reduction of business process exceptions.
- OpsView (Enterprise IT Monitoring)
- TIBCO Hawk (monitor infrastructure behavior, metrics and failures)
- TIBCO Clever (monitor functional and technical errors)
- TIBCO Spotfire (reporting)
- Pentaho Data Integration (ETL)
- Esper (Complex Event Processing)
- Confluence (Wiki based knowlegde base)
OpsView
OpsView is selected as the enterprise wide monitoring solution for IT components. OpsView monitors all critical components, collects events and provides an end to end view at the infrastructure level. OpsView is a generic solution and provides operators with a high level overview. It also has its limitations and it can not provide detailed information for each monitored sub-system such as the TIBCO ESB. For this it relies on TIBCO specific solutions as TIBCO Hawk and Clever.
TIBCO Hawk
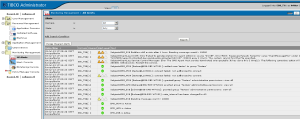
TIBCO Hawk is the software product selected for monitoring the components that support the TIBCO ESB.
- TIBCO BPM (business processes)
- TIBCO BusinessWorks (integration and business logic)
- TIBCO EMS (the messaging backbone)
- Servers (CPU / Memory / Disk)
For each of these components monitoring rules have been developed that monitor specific aspects such as component status, performance and resource usage. All collected events are stored in a database for viewing and reporting. When treshholds are violated alarms will go off and operators get notified by email. Alarms wich are classified as Critical are forwarded to OpsView.
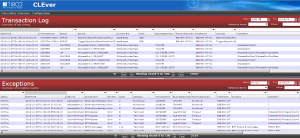
TIBCO Clever
- The component involved
- The activity executed when the failure occured
- Context such as incomming message, OrderID, correlation id’s (link to business process)
- Details such as error codes, error message, stackdump
- Improved “Error classification mechanism” based on a known symptom lookup table
- New symptoms can be added in real-time (refreshed every 10 minutes)
- Symptoms can be exported and imported
- Symptom table can be used to generate and update documentation
- Throttling: reduction of repeating exceptions (reduces email notificatons using Esper Complex Event Processing)
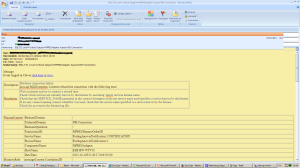
- Improved Email formatting (now includes a problem description and resolution)
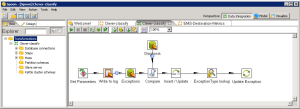
The classification system is based on a database table with known symptoms. The table includes the exception category, domain, type, a short description and a problem resolution. The classification mechanism enables fast exception recognition and improves reporting usability. After classification Clever routes these classified exceptions to specific solving groups based on criteria such as category and severity:
Finally all exceptions are stored in the Clever database and can be used in Spotfire reports.
TIBCO Spotfire
- Find failing components
- Determine root causes
- Determine impact of failures on availability
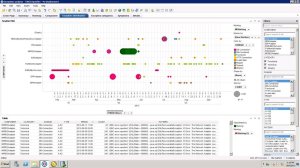
Events collected by TIBCO Hawk and Clever are stored in a database, the data is used to generate reports. Report: showing error distibution by component and type over a specified period of time. This particular report allowed us to find periodic recurring database problems.
These reports are now used by operations managers and testers.
- Operations manager:
- System availability
- Number of critical alerts (indicator for quality and load on operators)
- Type and number of alerts per component (find area’s for improvements)
- Testers:
- Find exceptions cause by bugs in deployed components
- Verify data quality of all logged events and exceptions
The TIBCO Spotfire product does not include data pre-processing capabilities such as ETL (Extraction, Transformation and Load). For these capabilities an Opensource solution was found Pentaho Data Integration (a.k.a Kettle).
This article is part of a series on monitoring.
I work as a consultant and developer, building and managing microservices.

it was so nice article.i was really satisfied by seeing this article and we are also giving tibco online training.the tibco online training center is one of the best online training center.
KiaOra,
Smokin hot stuff! You’ve trimmed my dim. I feel as bright and fresh as your prolific website and blogs!
I have a problem lately with the filters I have created in Text Areas. All the filters directly from the filter scheme seem to disappear for no apparent reasons. On the Filter panel, the filters show up with no errors.
Installed clients, as well as web clients, connect to the Spotfire Server. When users of either client log in to a Spotfire Server, two things happen before they get access: authentication and authorization.
This happens when I change tabs but there is no error message showing up. It does not happen all the time. I am not sure what is causing the problem.
Has anyone experience this before?
Very useful post !everyone should learn and use it during their learning path.
Obrigado,
Kevin
Thanks, i wrote a new article on TIBCO ESB coaching a team.
Write more, thats all I have to say. Literally, it seems as though you relied on the video to make your point. You obviously know what youre talking about, why throw away your intelligence on just posting videos to your site when you could be giving us something enlightening to read? egckcfdfbcge
I’m not that much of a internet reader to be honest but your blogs
really nice, keep it up! I’ll go ahead and bookmark your
website to come back in the future. All the best
Hi, I have just come across this very informative article. I’m also looking to implement some visibility on our Tibco deployment. As this article was written a few years ago, I was wondering if I could accomplish what you have posted using free or low cost products as I can’t immediately get any budget to purchase any tools mentioned. (We have Tibco Hawk installed but that’s all). Can I use Graylog instead of Opsview (also do you have any How-to guides as I’m new to this) Many thanks
Hi,
You could look at elasticsearch and graphite
I am happy that I detected this blog , precisely the right information that I was looking for! .
you’ve an excellent weblog right here! would you like to make some invite posts on my blog?
Where is your blog? I see a website with an alarmclock
Hello There,
10/10 !!! Thank you for making your blogs an embodiment of perfection and simplicity. You make everything so easy to follow.
I am trying to connect to LinkedIn API via BW Container edition and need Container edition and need to pass Access token to get the response. However i do not see any configuration related to OAuth in REST Refrence or Invoke REST API palltete.
Follow my new blog if you interested in just tag along me in any social media platforms!
Obrigado,
Preethi